Add anatomical detail to your nuclear imaging
Support lead candidate selection with high-throughput, detailed 3D biodistribution of fluorescent candidates before you radiolabel. Cryo-Fluorescence Tomography (CFT) complements nuclear imaging by showing where signal sits within the anatomy.
Two methods, one picture of where your compound goes
CFT is a complementary volumetric imaging technique that produces co-registered anatomical and fluorescence images in 3D at approximately 20 to 55 µm resolution. It fits into existing nuclear imaging workflows: nuclear imaging shows how a tracer distributes in living animals, and CFT adds ex vivo detail on where a fluorescent counterpart localizes within the anatomy, down to the sub-organ level. CFT is destructive, as samples are frozen and sectioned.
Screen a parallel cohort
Image fluorescent analogues with CFT to help prioritize candidates before you radiolabel for nuclear imaging.
Add anatomical context
Follow nuclear imaging with CFT to see where signal localizes within organs and tissues.
Alongside the methods you already use
Each nuclear method answers a different question. CFT adds high-detail 3D distribution of a fluorescent counterpart, so you can screen candidates quickly and compare signal distribution across groups before choosing what to radiolabel.
See sub-organ detail.
At approximately 20 to 55 µm, CFT resolves structures within organs, including nerves and bone, that may be less apparent in nuclear imaging.
Co-localize signal with anatomy.
3D whole-body fluorescence with co-registered anatomy shows where signal sits relative to organs, tissues, and structures.
Screen quickly, compare across groups.
Whole-body, high-detail datasets let you compare signal distribution across groups to help with candidate selection before you radiolabel.
See your probe alongside its biology.
Visualize multiple spectrally distinct fluorescent signals in the same sample, such as a probe alongside its target, a delivery vehicle and its cargo, or a cell population.
Explore the vehicle and cargo dataset →Investigate unexpected biodistribution.
Use CFT as an ex vivo endpoint to see where a fluorescent analogue or dual-labeled probe accumulates, including off-target sites.
See a tumor in its anatomical context
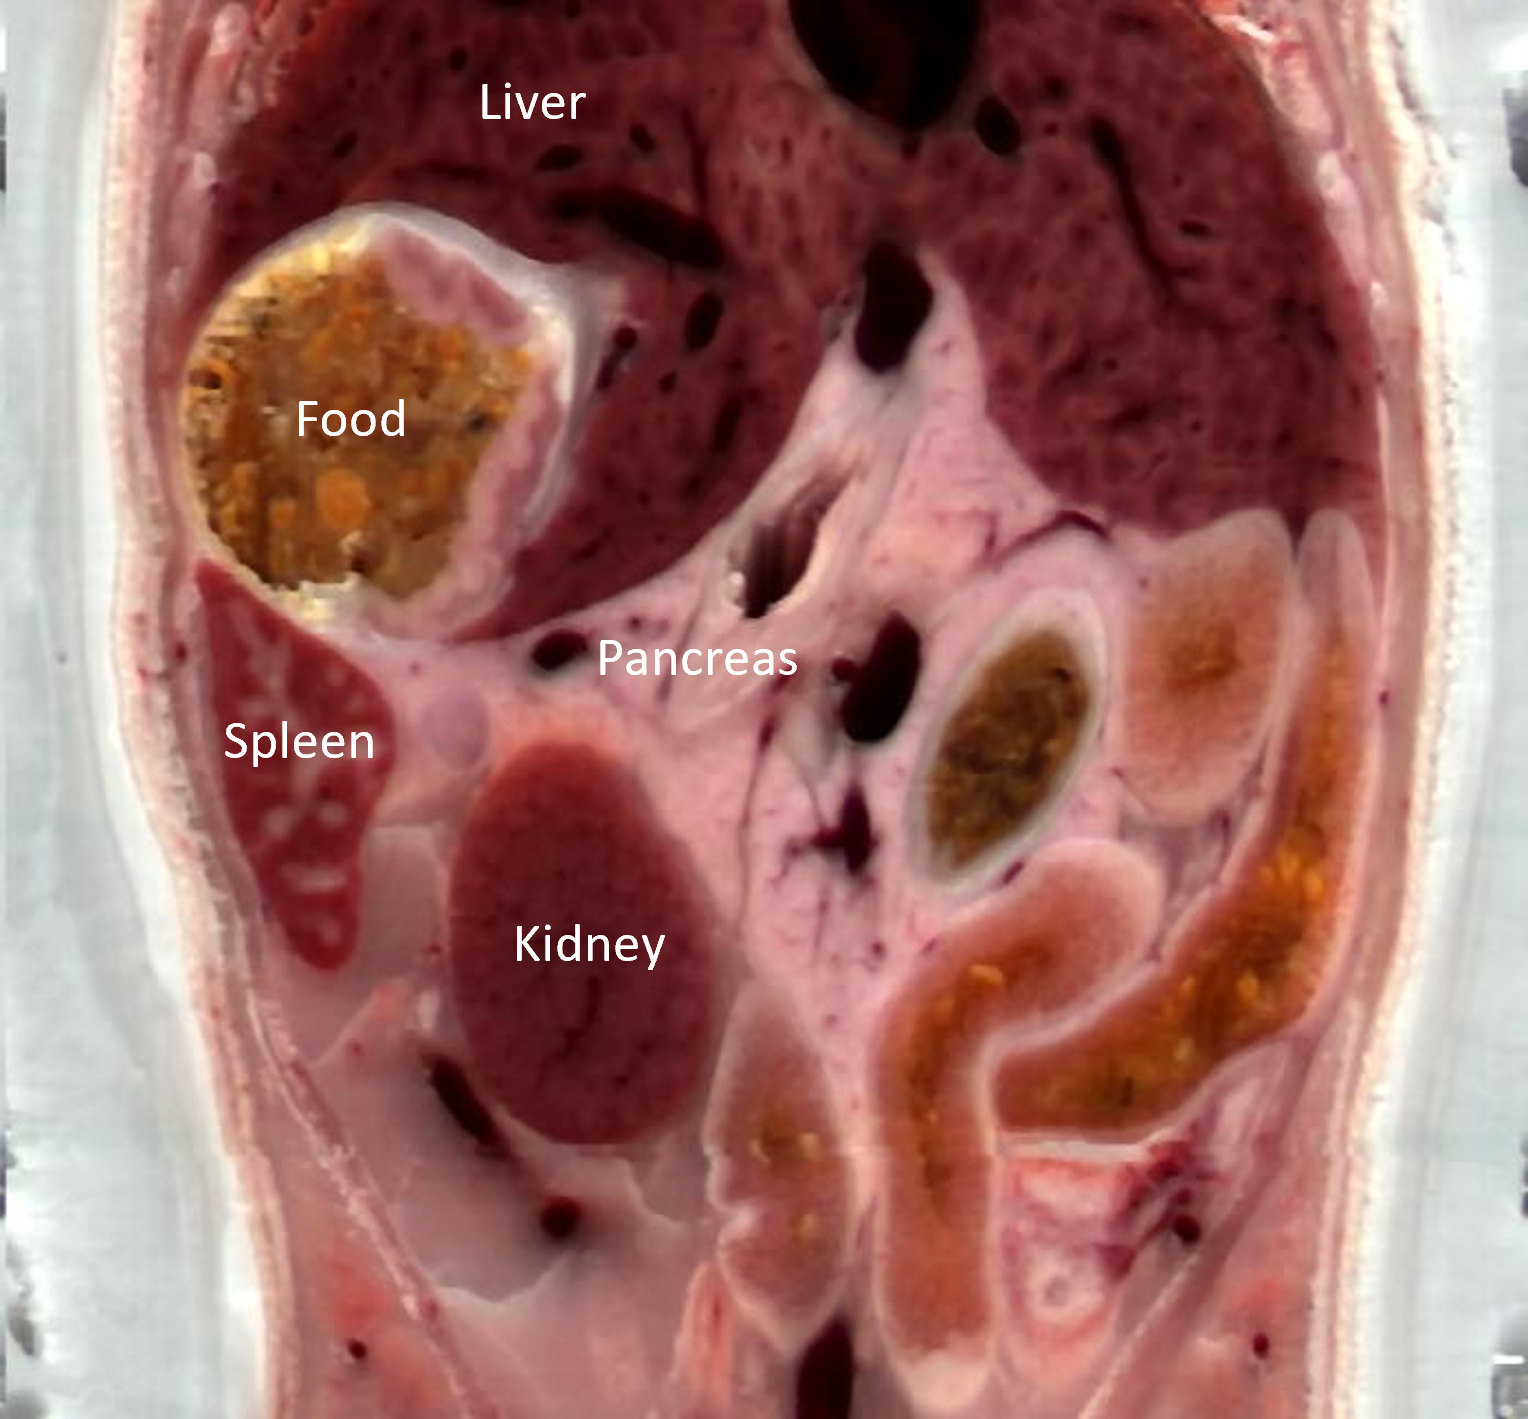
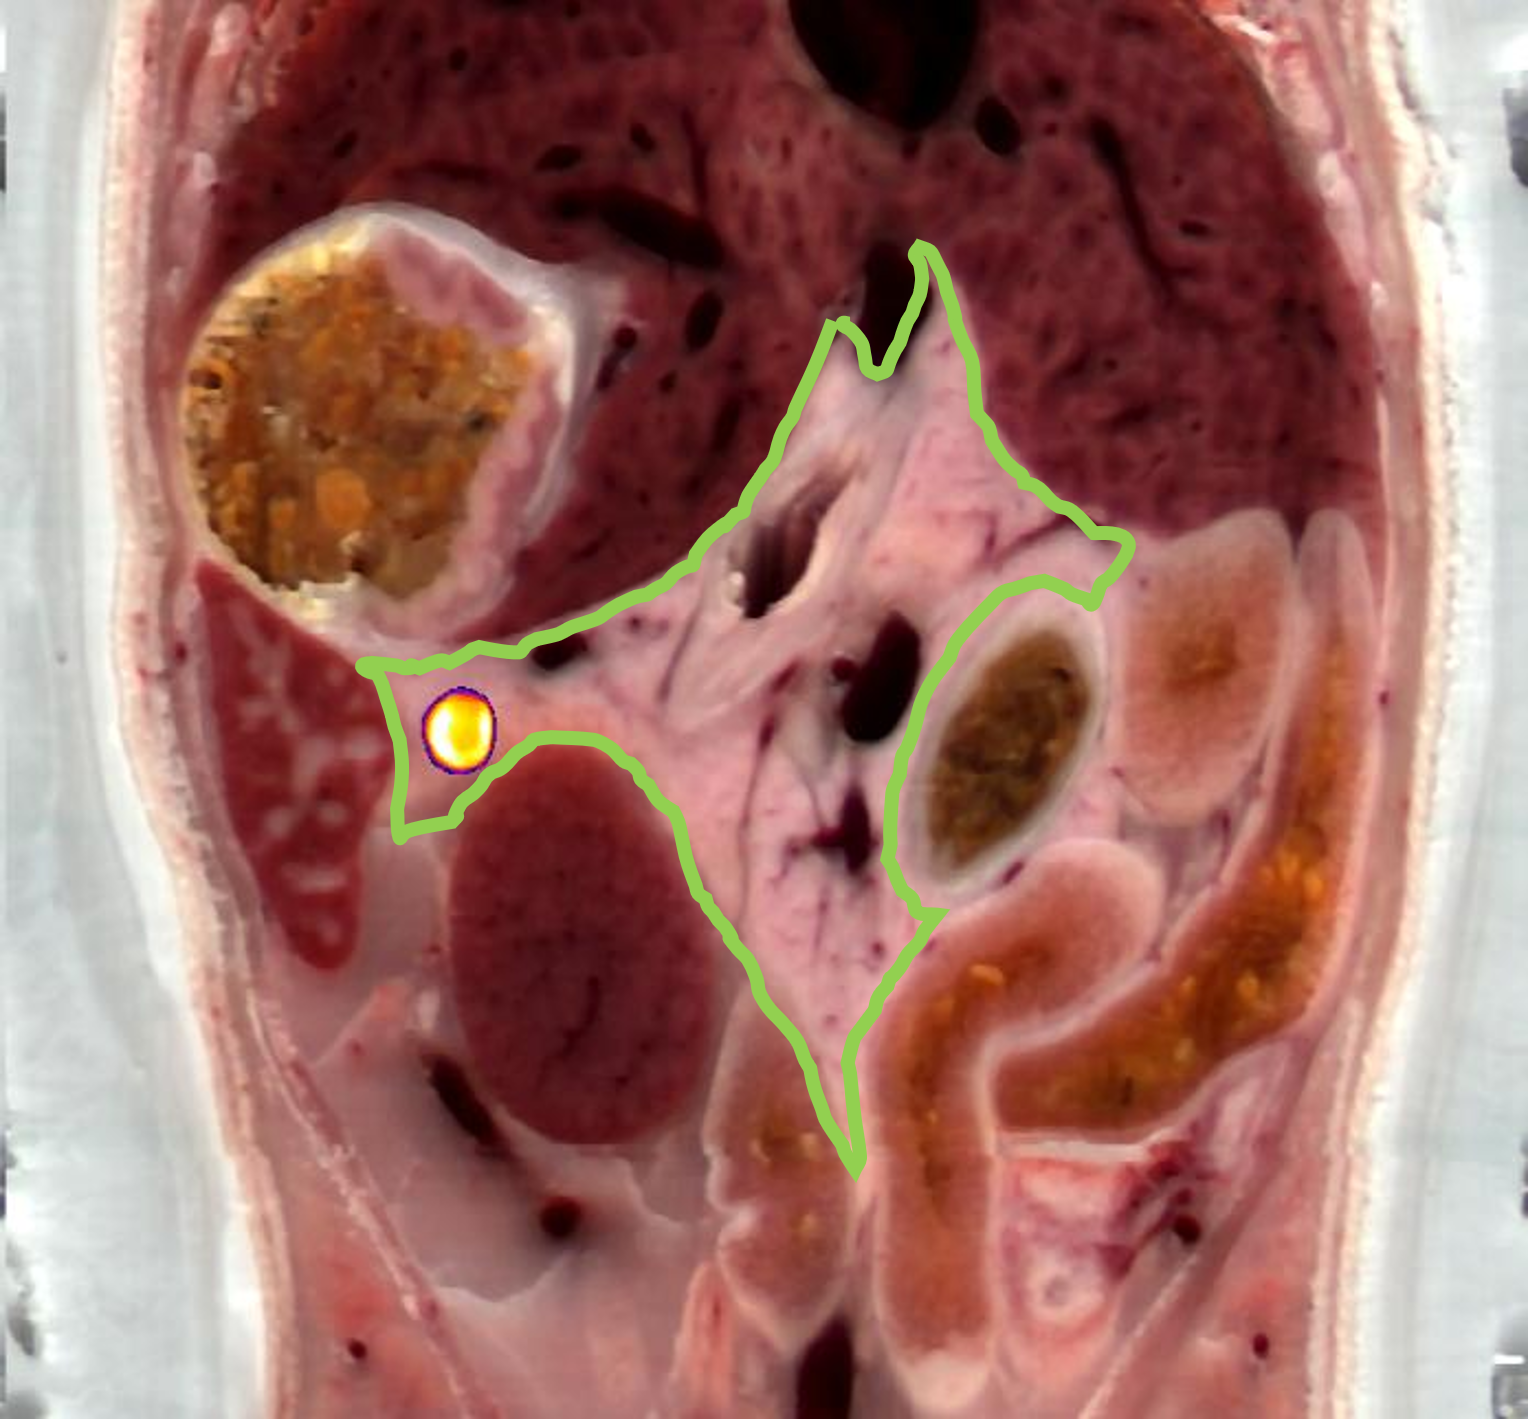
CFT pairs a fluorescence image with a white-light anatomical image of the same section. Here, the fluorescence image shows the tumor. Overlaying the two places the tumor next to the surrounding organs and tissues, so you can see where it sits and what it borders.
CFT screening of PSMA ligands with whole-body comparison of signal distribution
CFT screening identified a leading candidate.
Sub-organ detail in kidney and glands
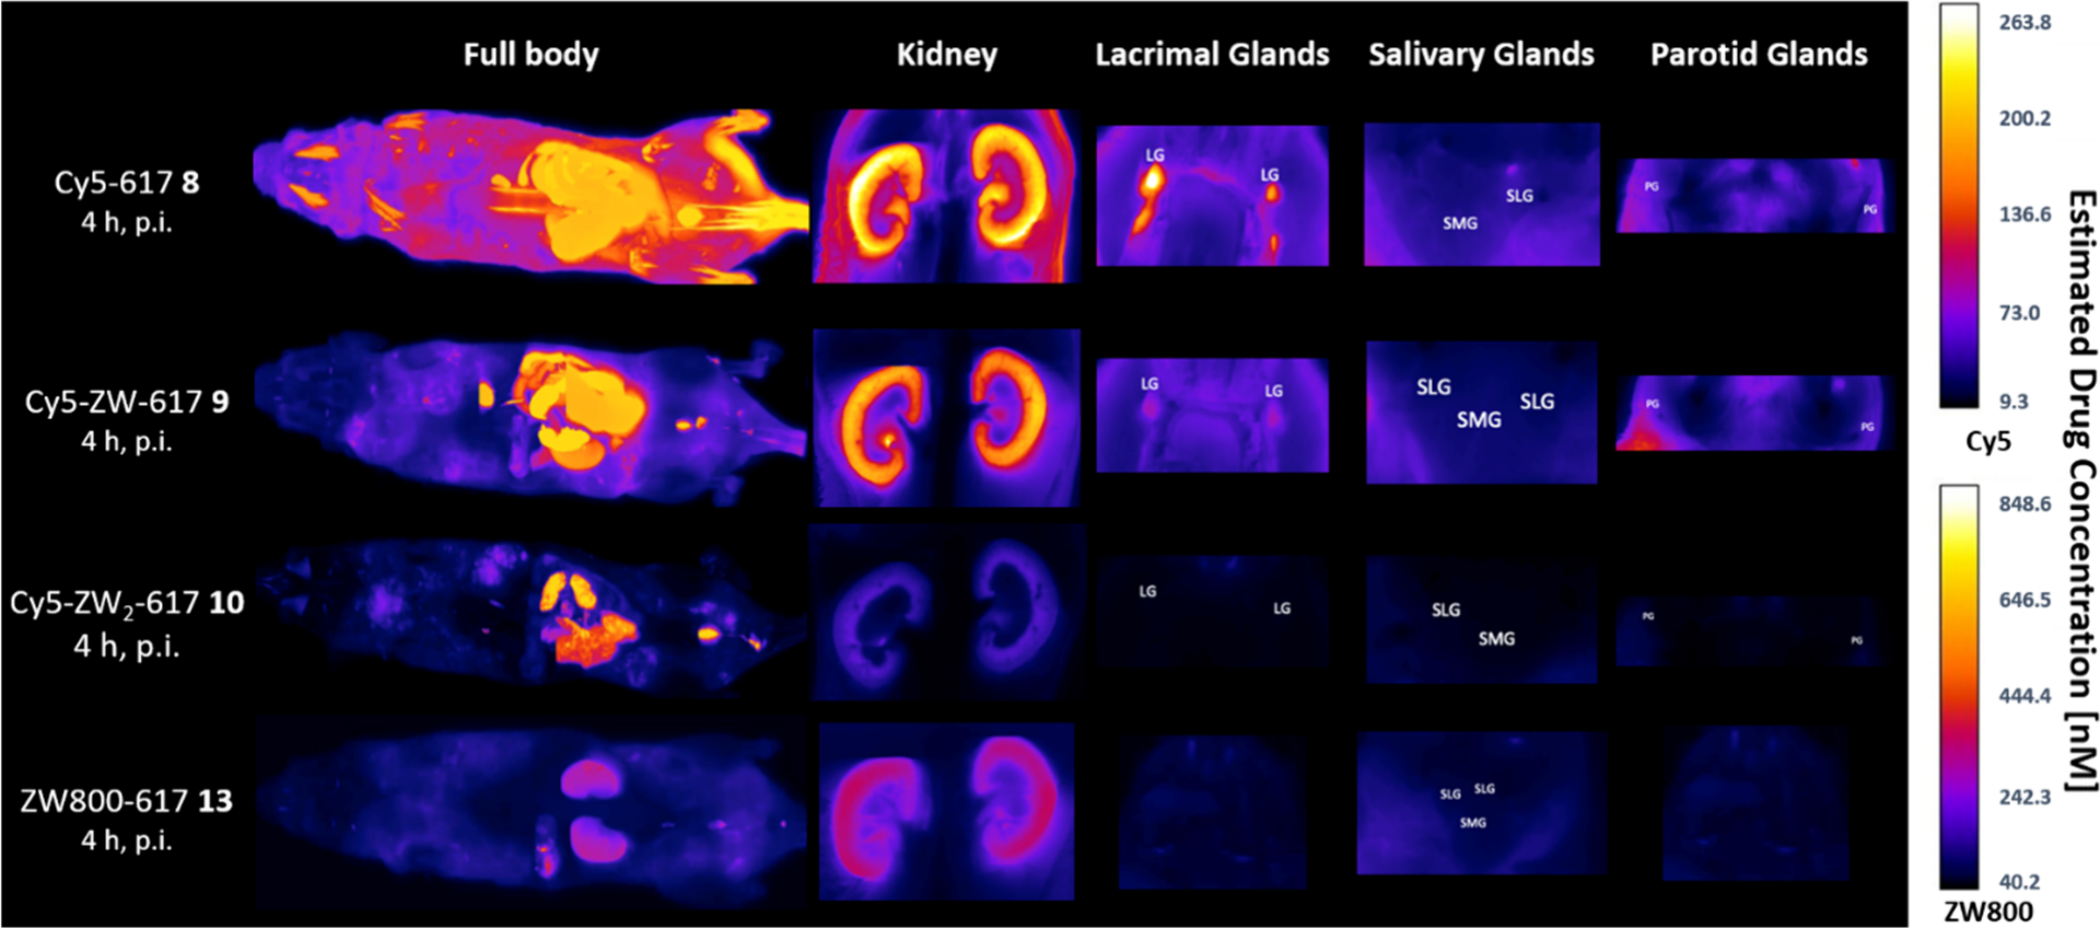
Whole-body comparison for candidate prioritization
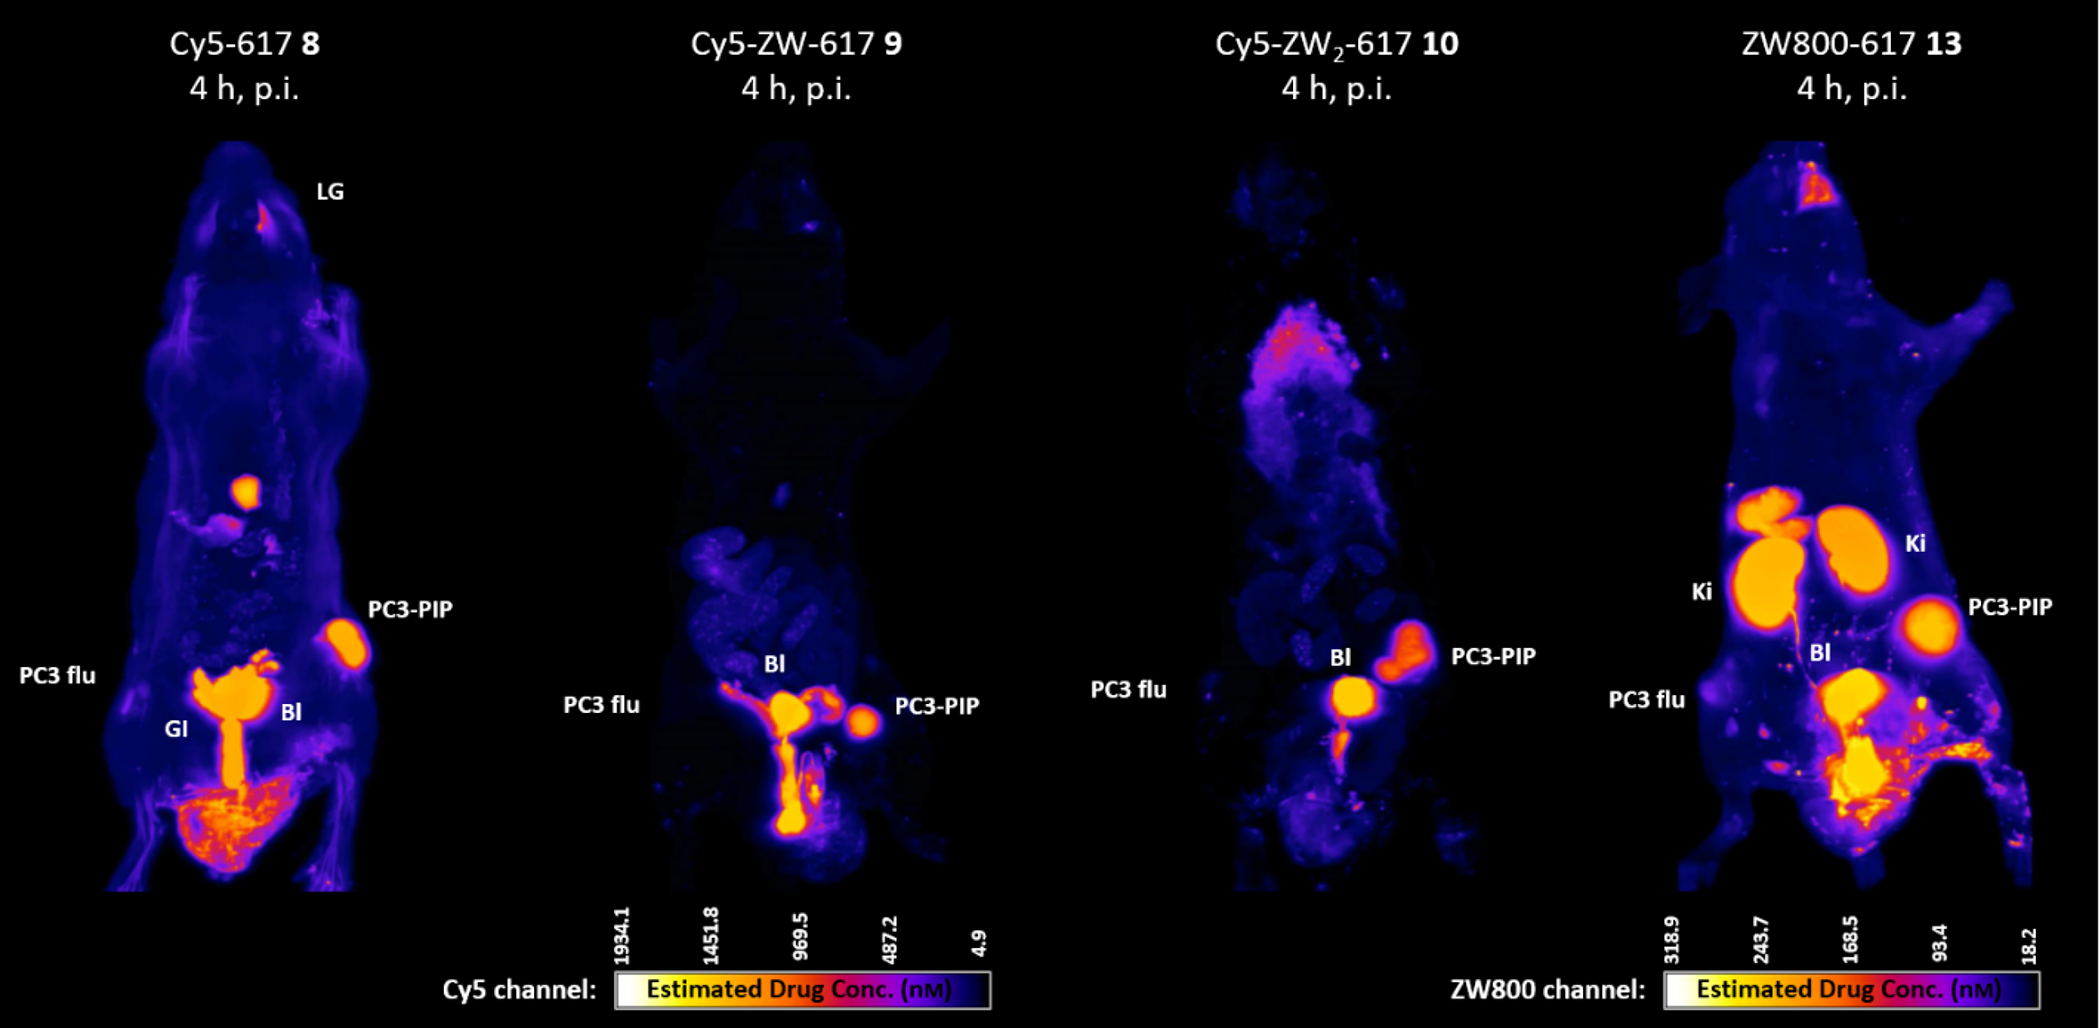
Whole-body CFT, 4 h post injection. PC3-PIP: PSMA+ tumor. PC3 flu: PSMA- tumor. Bl: bladder. Ki: kidney. LG: lacrimal gland. GI: gastrointestinal tract.
Tumor uptake and tumor-to-tissue ratios
Fluorescence measured in tumors and normal tissues (A), and the resulting tumor-to-tissue uptake ratios (B), compared across the four compounds.
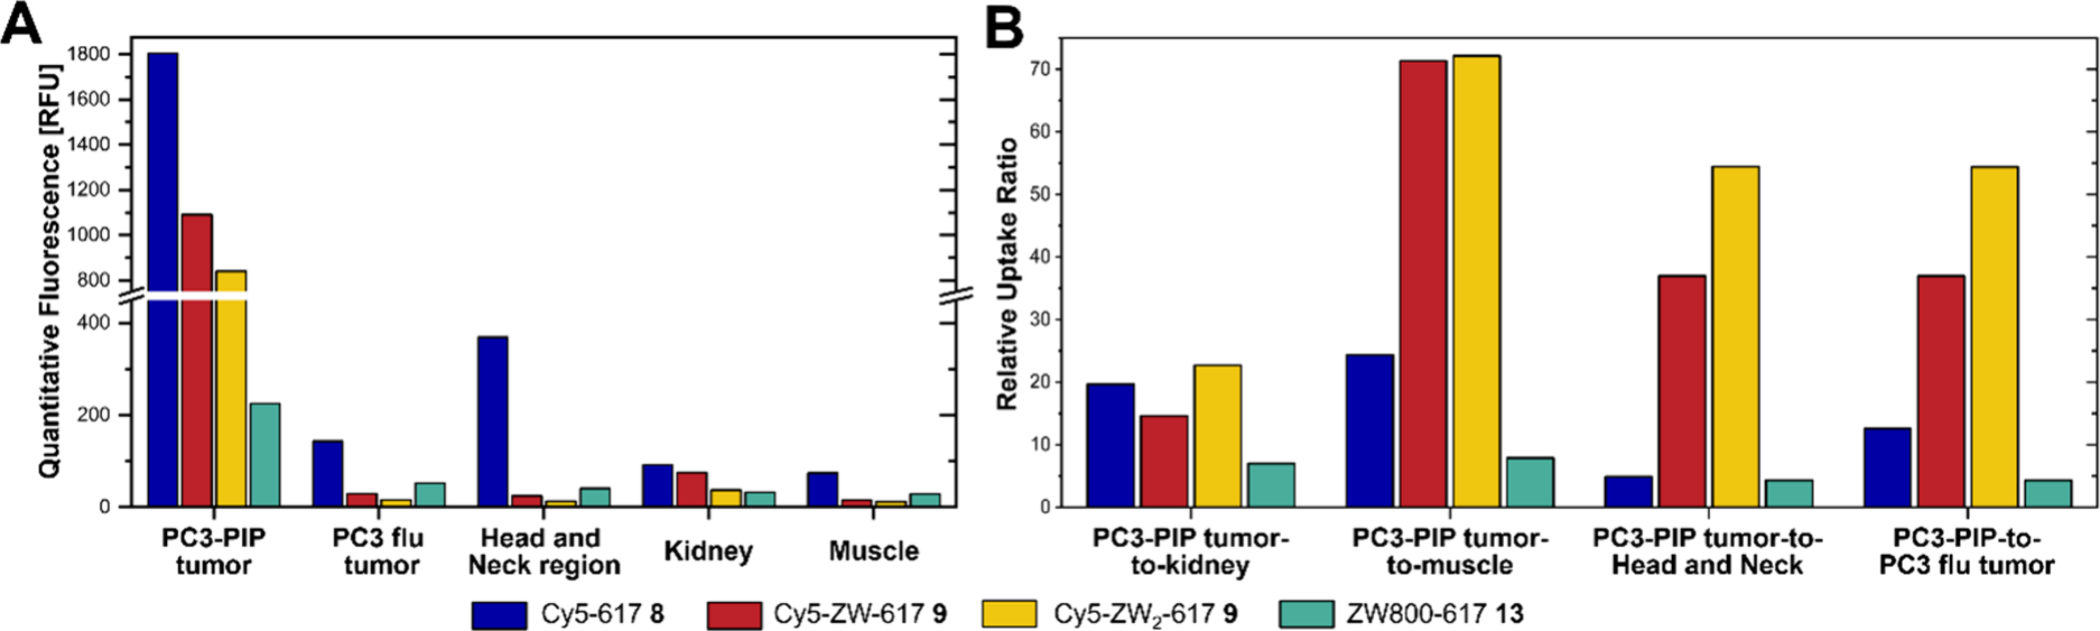
Spickschen LFV, Thünauer R, Swierzewski AJ, Van Wazer JM, Fears A, Silva MD, Thorek DLJ, Oetjen E, Maison W. J. Med. Chem. 2026;69(6):7364-7376. doi:10.1021/acs.jmedchem.5c03849
Read the publication in J. Med. Chem. →FAP-targeting ligand: CFT alongside SPECT
Analogous fluorescently labeled and radiolabeled FAP-targeting compounds were studied using CFT, SPECT, and gamma counting. Broad tissue distribution was similar between CFT and SPECT. CFT added spatial detail on tumor heterogeneity and bone-associated localization.
The study compared analogous compounds with different labels. Any screening approach should consider whether the fluorescent label alters a compound's properties.
Built for teams that image with nuclear methods
Vehicle and cargo co-localization, shown in the EMIT Viewer.
Explore the co-localization yourself
Open a multiplexed CFT dataset in your browser, page through slices and toggle fluorescence channels to see where each signal sits within the anatomy. Nothing to install.
Comparing candidates or investigating unexpected biodistribution?
Tell us about your program and we will outline a small CFT pilot study.